Interactive flood map allows you to see theoretical flooding
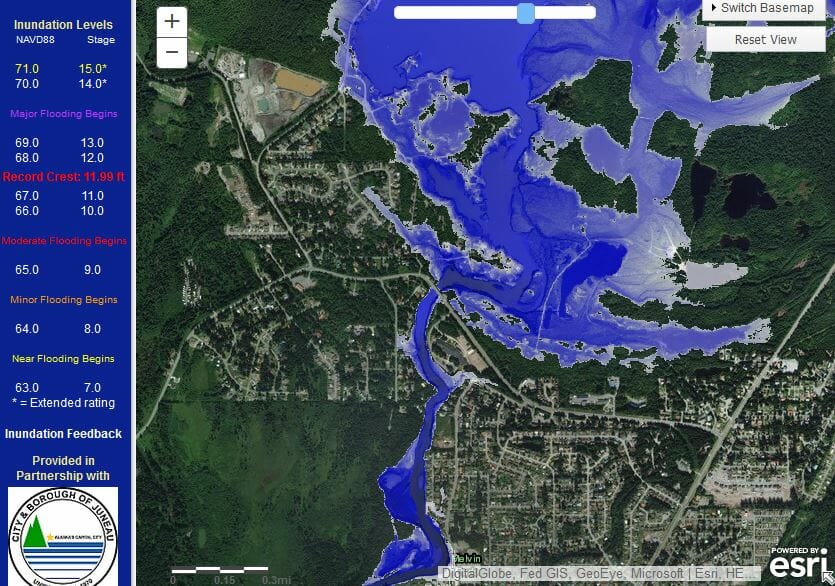
With a flood watch in effect from Thursday afternoon to Friday afternoon (July 19-20), you may be wondering how a bad flood could impact the Mendenhall Valley. The Army Corps of Engineers and USGS worked with the CBJ to develop an interactive flood map that allows you to see what theoretical flooding would occur beyond historic levels: https://water.weather.gov/ahps2/inundation/index.php?gage=mnda2 (Click on the flood stage numbers on the left to see what areas on the map will be impacted.)
The National Weather Service in Juneau keeps track of the Mendenhall Lake level. At 10:15 a.m. today (July 18), the lake level was at 6 feet. Flood stage is 9 feet, and the record level was 11.99 feet in 2016. The Weather Service is currently forecasting the lake level to crest at about 12 feet by midnight Thursday, however “there is some uncertainty in the event, as the glacial dynamics have changed from previous years.”
With the interactive map, you can look at predicted inundation levels up to 15 feet.